4. Regional and Remote Students
4. Regional and Remote Students
4.1 Scholarship Support for Regional and Remote Indigenous Students
Section 21 (3) (a) of ‘the Guidelines’ requires that a minimum of 95% of the Commonwealth Equity Scholarship amount paid to regional and remote students in the preceding year (i.e. 2018) be paid to regional and remote students in 2019. For UNE the minimum funds to be offered in 2018 were $126,66.24 (i.e. 95% of $133,218.51 - being 2018 funds paid)[1](See Table 19) The actual amount of $275,283.93 offered to remote or regional Indigenous students in Scholarship support by UNE in 2019 represents a funding offer of almost 207%. This is more than double the minimum percentage funds offered required.
Table 19: Scholarship data for remote and regional students.
LEVEL OF STUDY | Education Costs | Accommodation | Reward | TOTAL | ||||
|---|---|---|---|---|---|---|---|---|
$ | No. | $ | No. | $ | No. | $ | No. | |
A. 2018 Payments | 98,204.76 | 47.75 | 28,013.75 | 5.25 | 7,000 | 7 | 133,218.15 | 60 |
B. 2019 Offers | 194,792.93 | 89 | 46,491.00 | 10 | 34,000 | 17 | 275,283.93 | 117 |
C. Percentage (C=B/A*100) | 206.64% | 195% | ||||||
2019 PAYMENTS | 128,068.19 | 76 | 34,781.57 | 10 | 28,000.00 | 14 | 190,849.76 | 100 |
Source: Oorala Aboriginal Centre
* Source, UNE 2018 ISSP report available at: www.une.edu.au
4.2 The rise and fall of EFTSL For students From Remote and Regional Areas
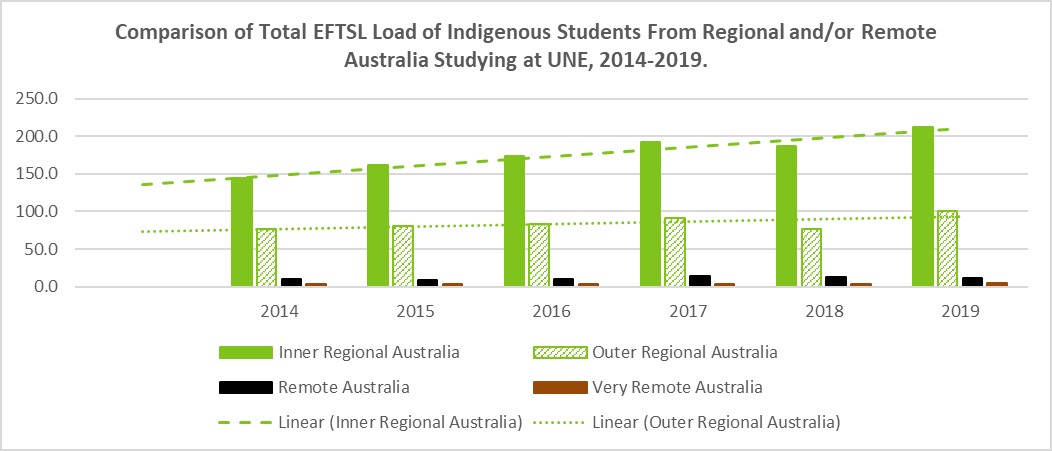
Students from regional and/or remote Australia accounted for 329.1 (or 67%) of the total EFTSL of Indigenous students at UNE in 2019 (Table 20). This lies just 3 percentage points below the mean EFTSL load of 70.8% for Indigenous students from regional and remote Australia that has held for UNE over the last 6 years. Whilst the EFTSL load of Indigenous students from regional and/or remote Australia has remained relatively steady over the past six years, it is noted that the number of Indigenous students from Inner Regional Australia has steadily increased (Figure 9). This is likely to reflect broader demographic changes in regional Australia such as the growth of regional cities as population and service hubs and corresponding declines in more remote communities due to prolonged issues with water security in 2019.
Table 20: Study Load (EFTSL) of Indigenous students studying at UNE in 2019 by their location
Study Load (EFTSL)/LOCATION
| CALENDAR YEAR | |||||
|---|---|---|---|---|---|---|
2014 | 2015 | 2016 | 2017 | 2018 | 2019 | |
Major Cities of Australia | 82.6 | 98.3 | 97.5 | 133.8 | 121.6 | 154.8 |
Inner Regional Australia | 145.0 | 161.3 | 174.1 | 192.3 | 186.6 | 212.6 |
Outer Regional Australia | 76.3 | 80.1 | 83.1 | 91.2 | 79.4 | 100.2 |
Remote Australia | 9.5 | 9.1 | 10.4 | 14.1 | 13.0 | 11.2 |
Very Remote Australia | 3.5 | 3.1 | 3.4 | 3.9 | 3.6 | 5.1 |
Overseas | 1.4 | 1.3 | 1.4 | 2.0 | 1.5 | 1.6 |
Location Data Not Available | 1.5 | 2.1 | 3.3 | 3.9 | 5.3 | 7.8 |
GRAND TOTAL | 319.7 | 355.3 | 373.0 | 441.2 | 411.0 | 493.3 |
Total Regional and Remote | 234.2 | 253.6 | 270.9 | 301.5 | 279.9 | 329.1 |
% Total Regional and Remote | 73% | 71% | 73% | 68% | 69% | 67% |
Source: Student Profile Excel Worksheet dated 22/02/2020 prepared by UNE Business Intelligence Unit.
Figure 9: Comparison of total EFTSL of Indigenous students at UNE from Regional and/or remote Australia for the period 2014-2019.

Source: Student Profile Excel Worksheet dated 22/02/2020 prepared by UNE Business Intelligence Unit.

