Real-time remote-sensing based monitoring for the rice industry
Supported by: AgriFutures Rice Program (Grant PRO-013078)
Collaborators: NSW DPIRD, SunRice, Rice Extension
Duration: 2021 – 2025
Summary:
The productivity and sustainability of rice farming can be enhanced by optimising the timing and location of field management activities, including sowing, fertiliser application, irrigation, field drainage, and harvest. We are developing tools for Australian growers to support decisions that achieve these aims. The project outputs are:
- Crop location mapping
- Ponding date detection
- Phenology (panicle initiation and flowering)
- Growth curves
- Grain moisture (optimum field draining and harvest dates)
- Yield forecasts
- Industry-wide benchmarking analysis
These are delivered to each grower in a dashboard that contains all data for their farms since 2018 and is updated daily with information for the current season’s crops. The models are also used to monitor crops, forecast yield and harvest and analyse productivity across the industry.
1. Crop location mapping
Time-series of satellite data, including Sentinel-1 (radar) and Sentinel-2 (optical), are used to predict the probability that every pixel across the Riverina is rice. These pixel probabilities are then vectorised to generate a shapefile of field boundaries.
More information:
![]()
![]()
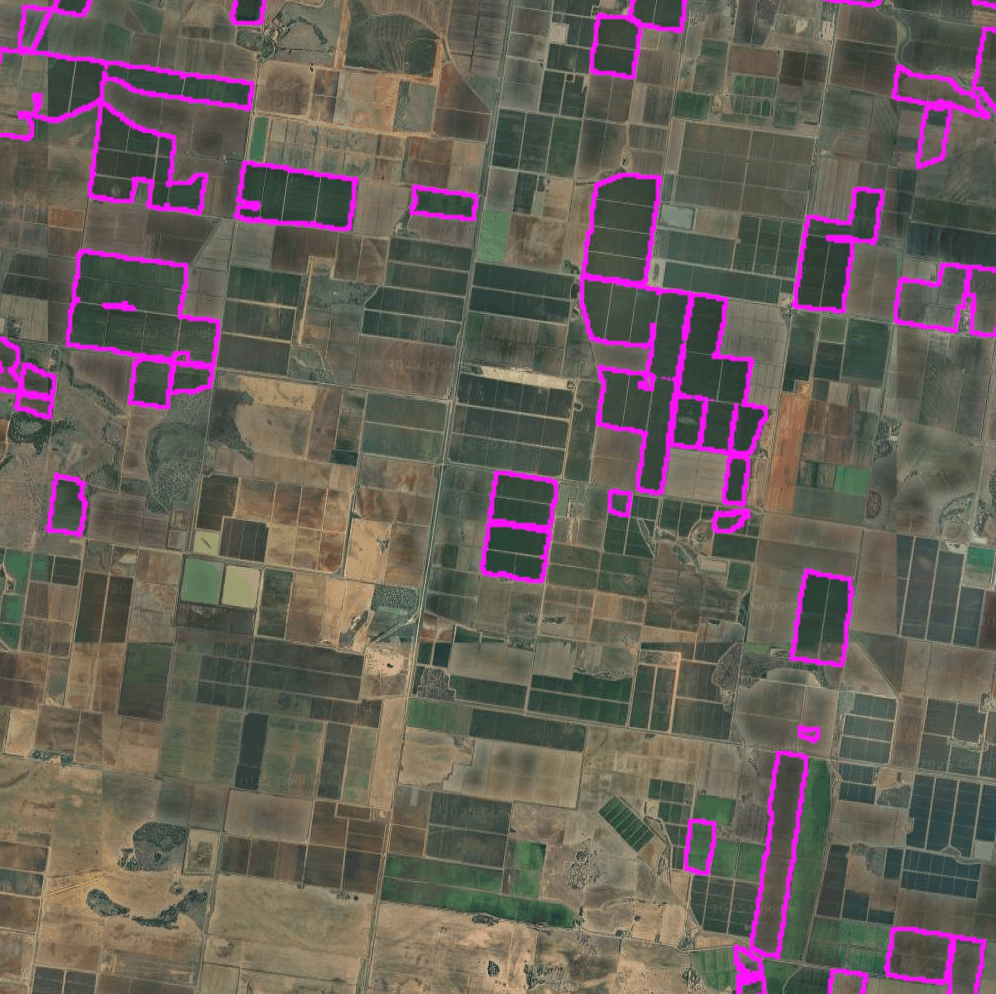
Figure 1. Pixel-level rice probability (left) and vectorised rice field boundaries (right).
2. Ponding date detection
Most rice in Australia is grown in a ponded environment for a significant portion of the season. Crops sown using aerial and dry broadcast methods are ponded close to the sowing date. Drill sown crops have intermittent irrigation applied until ponded around the three-leaf vegetative growth stage. Ponding date is a crucial factor influencing speed of crop progression to subsequent growth stages and is important for modelling greenhouse gas emissions. Our ponding date model uses a time-series of data from the Sentinel-2 satellites over each field. The short-wave infrared bands are particularly sensitive to water applications. The model estimates the probability that the field was ponded at each date by comparing images before and after that date to determine if observed changes over time are likely due to water. An example of ponding (or permanent water, PW) prediction is shown for a paddock in Figure 2. The date was predicted to be 17 December. We assess the accuracy of the predictions in each new season against data collected by NSW DPIRD across all growing regions. In 2024 the mean absolute error of ponding date prediction for more than 60 commercial sites was 4.8 days.
More information:
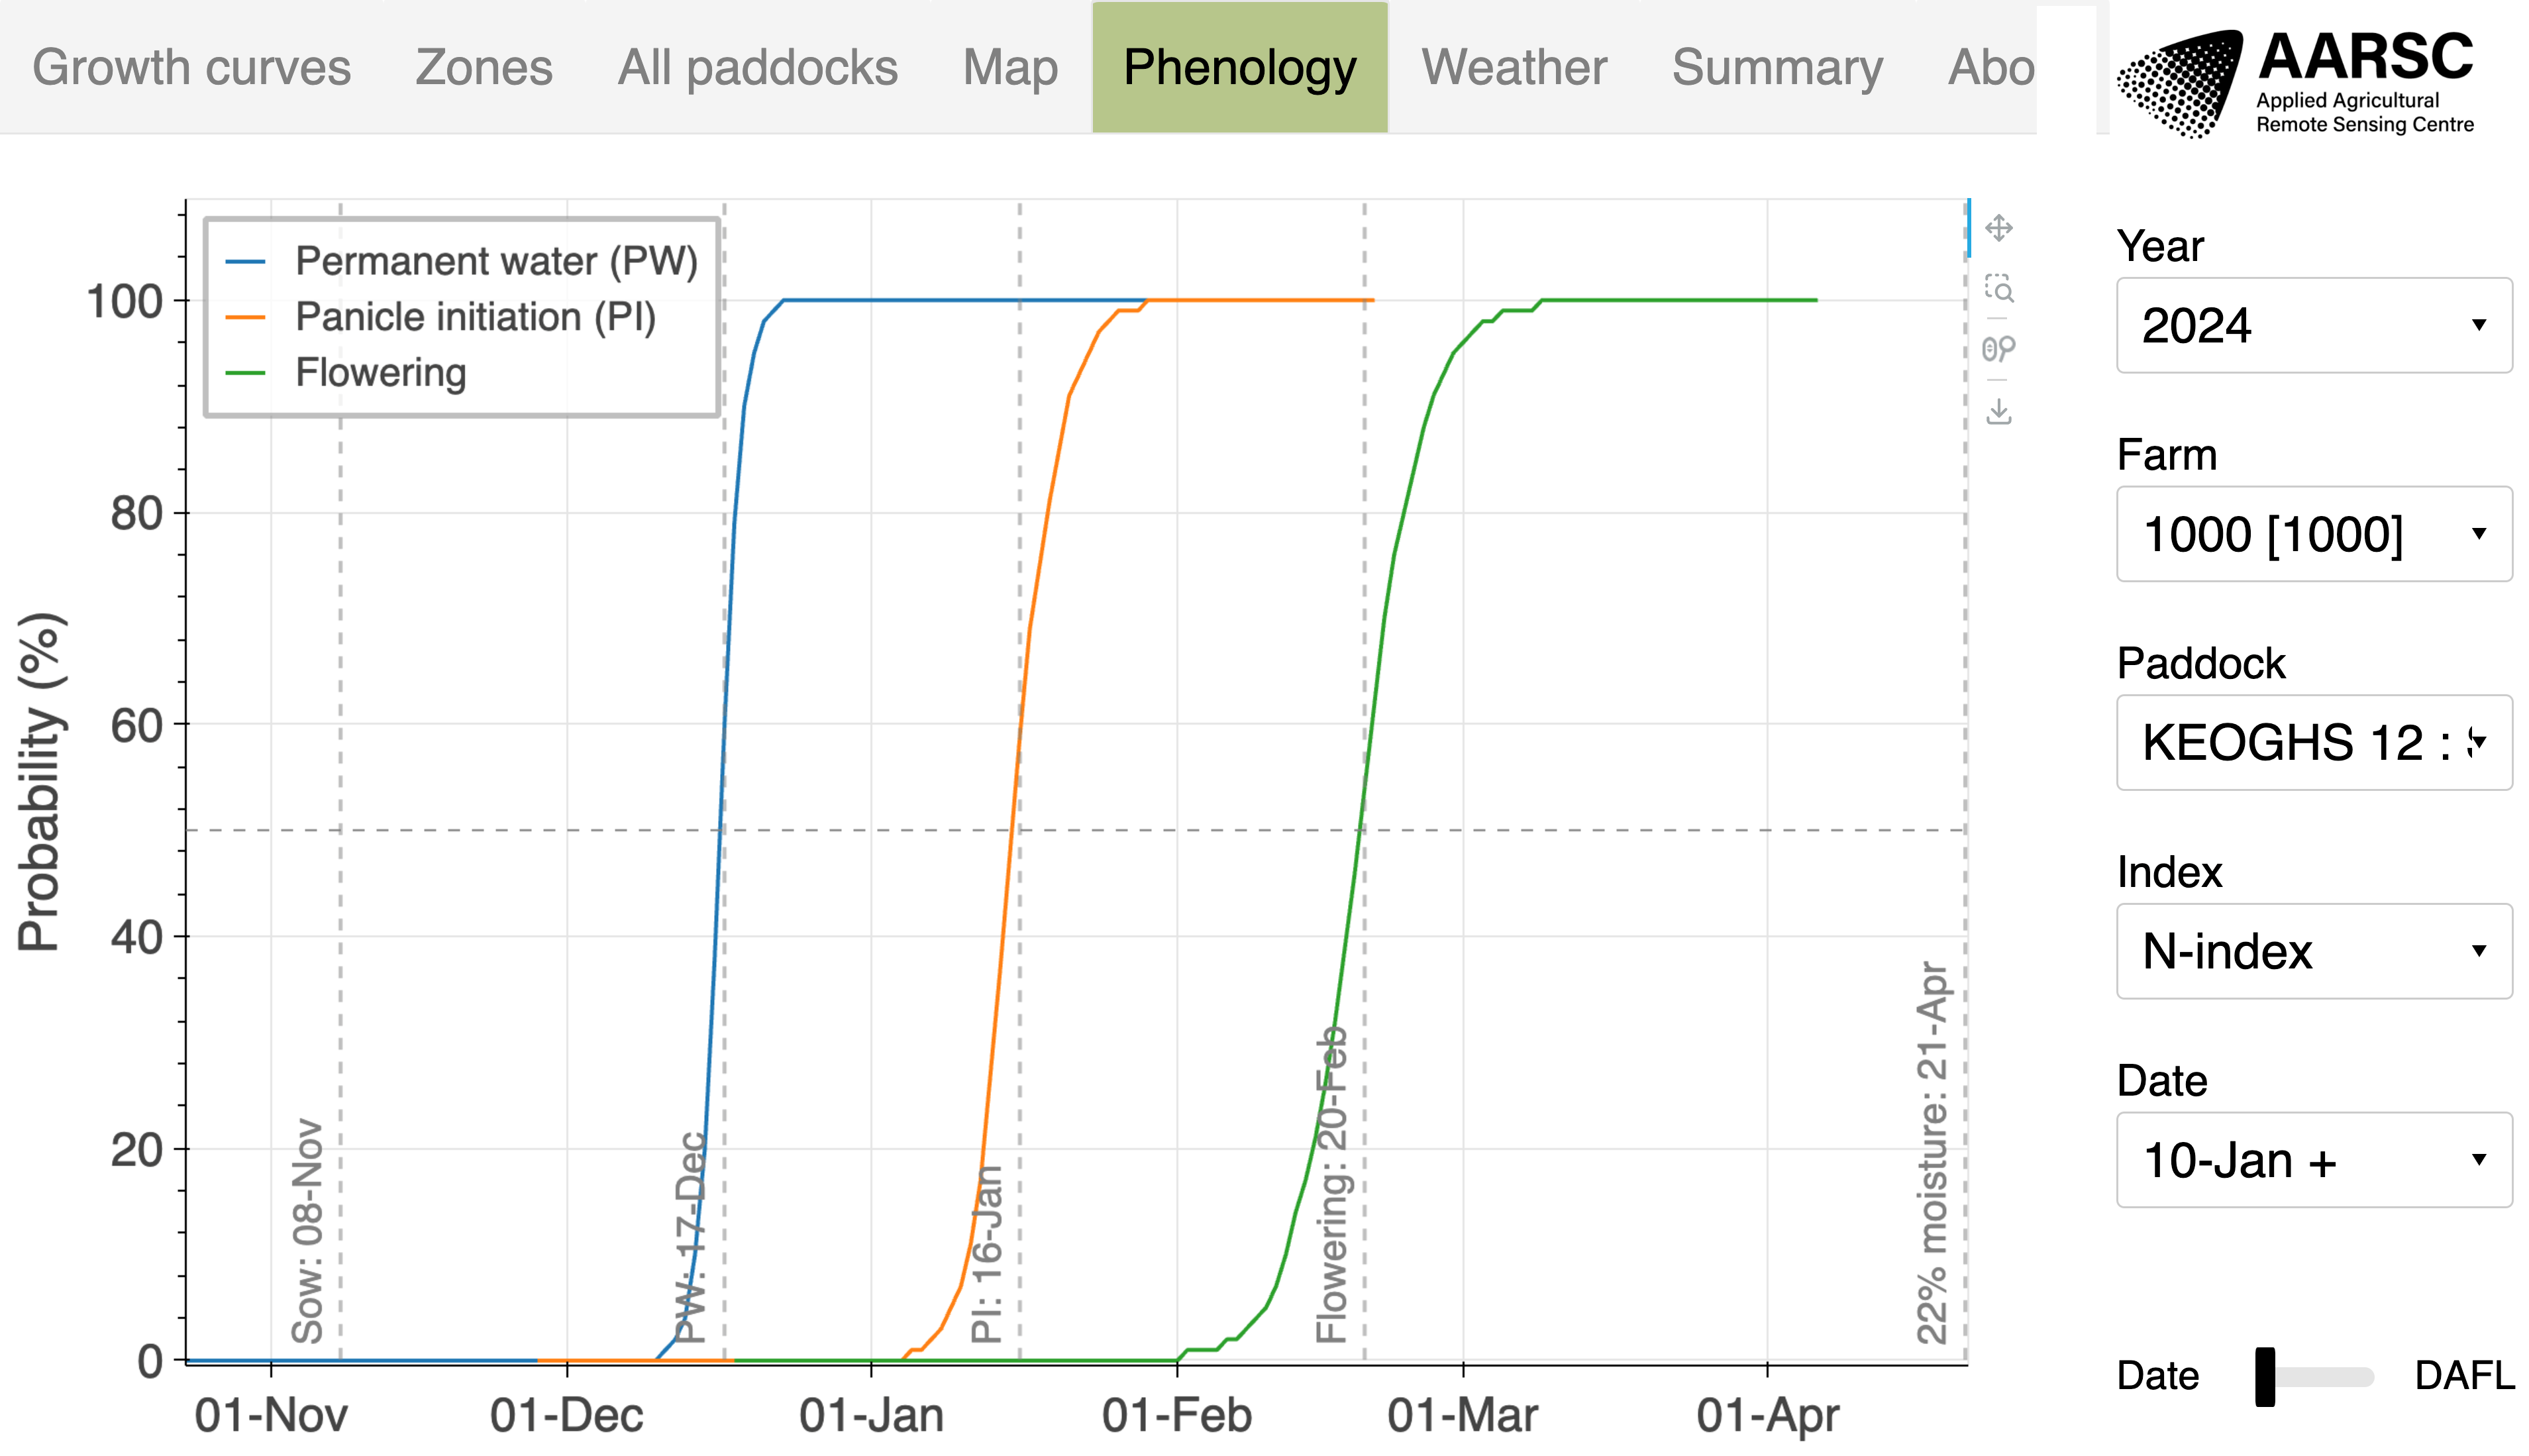
Figure 2. Screenshot from a rice farm dashboard, showing the ponding (PW) and phenology (PI and flowering) date predictions.
3. Phenology prediction
Once the sowing date, ponding date and rice variety are known, the phenology models provide estimates of the probability of reaching the panicle initiation (PI) and flowering growth stages at each date. PI is important as the last opportunity to efficiently address nitrogen deficiencies. Flowering marks the end of the reproductive growth stages including microspore, when rice is susceptible to cold-temperature induced sterility and requires deeper water to insulate against this risk.
The PI and flowering phenology models use accumulated temperatures from sowing and ponding, together with variety and sowing method information. They are machine learning models, trained using field trial and commercial site data collected by NSW DPIRD since 2013, including many varieties, regions and sowing methods. Spatial weather observations are collected from the SILO dataset, and weather forecasts from the NOAA Global Forecast System (16-day forecasts). To provide preliminary predictions beyond the forecast horizon, SILO observations since 2020 are averaged. Weather data is updated daily in the software system to ensure the latest accurate data is used.
An example is shown in Figure 2, where the predicted most likely PI date was 16 January, and Flowering 20 January. In 2024, the PI predictions had a mean absolute error of 3.2 days, and flowering of 6.0 days across 64 commercial crops.
More information:
4. Growth curves and nitrogen maps
Growth curves track the trajectory of in-season crop progress. We supply several indices including NDVI and a chlorophyll index related to nitrogen status. Paddocks are split into 5 zones, to allow understanding and management of in-field spatial variability. The growth curves from all crops from 2018 on have been compiled, specific to each variety and growing region. These are used to benchmark the progress of a current crop against similar crops from previous seasons. A crucial part of this work is fine-tuned cloud detection algorithms to ensure the highest quality and frequency data is used, and smoothing algorithms optimised to provide a continuous estimate of growth between satellite observations.
An example is shown in Figure 3, where the purple region includes 80% of all crops from the same region and variety, and the green curve is the current crop. As can be seen, it allows tracking the relative earliness/lateness of the crop (x-axis shift), as well as remotely sensed proxies of biomass and nitrogen (y-axis).
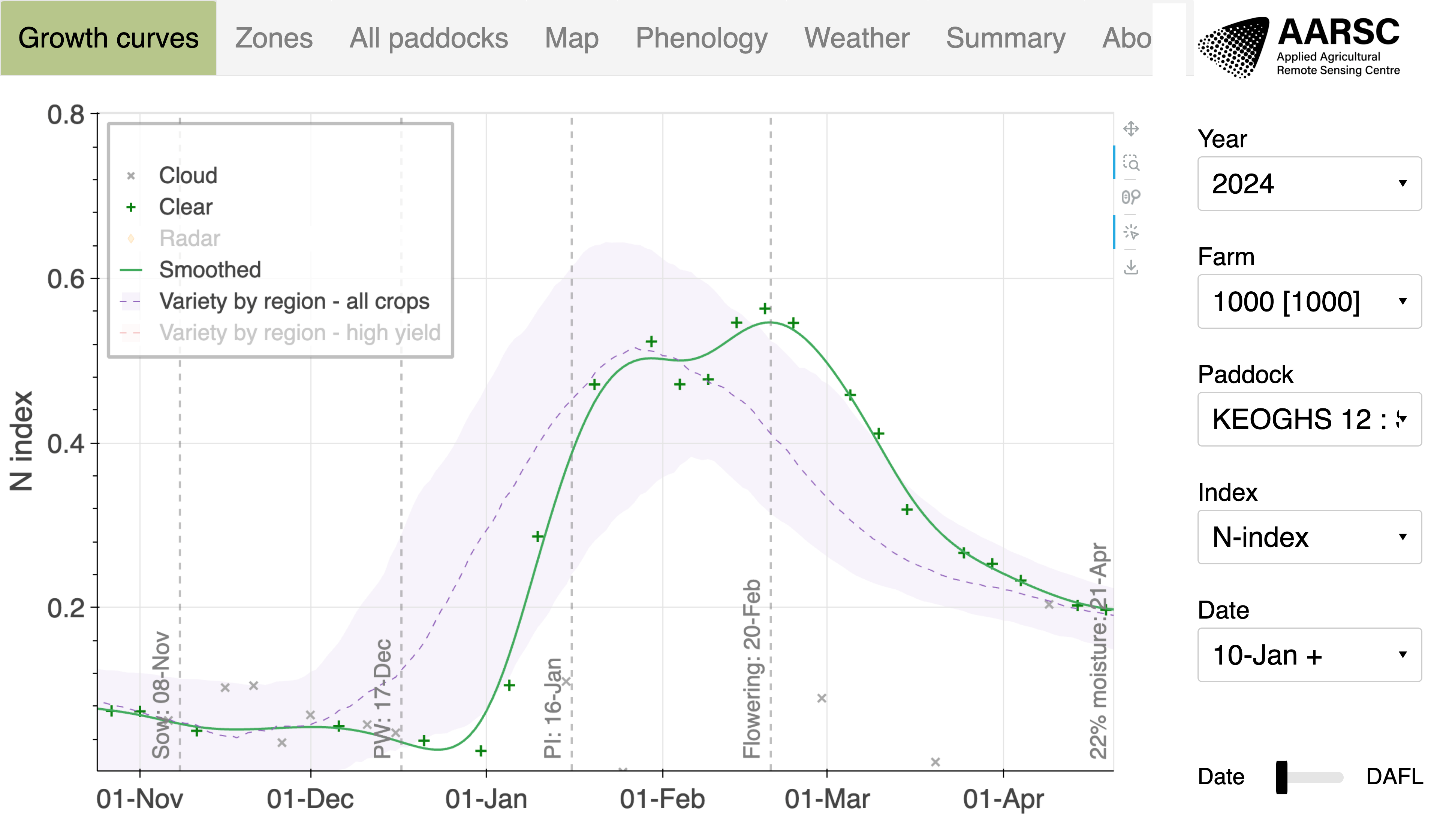
Figure 3. Growth curve of a paddock (green) benchmarked against historical averages from similar rice crops (purple).
One key application of the growth curves is to support decisions on applying nitrogen at PI to achieve maximum yield. Another tool for this decision is nitrogen uptake maps, which have been developed in collaboration with NSW DPIRD as part of their AgriFutures agronomy projects. These are also being delivered through the dashboards, and an example is shown in Figure 4.
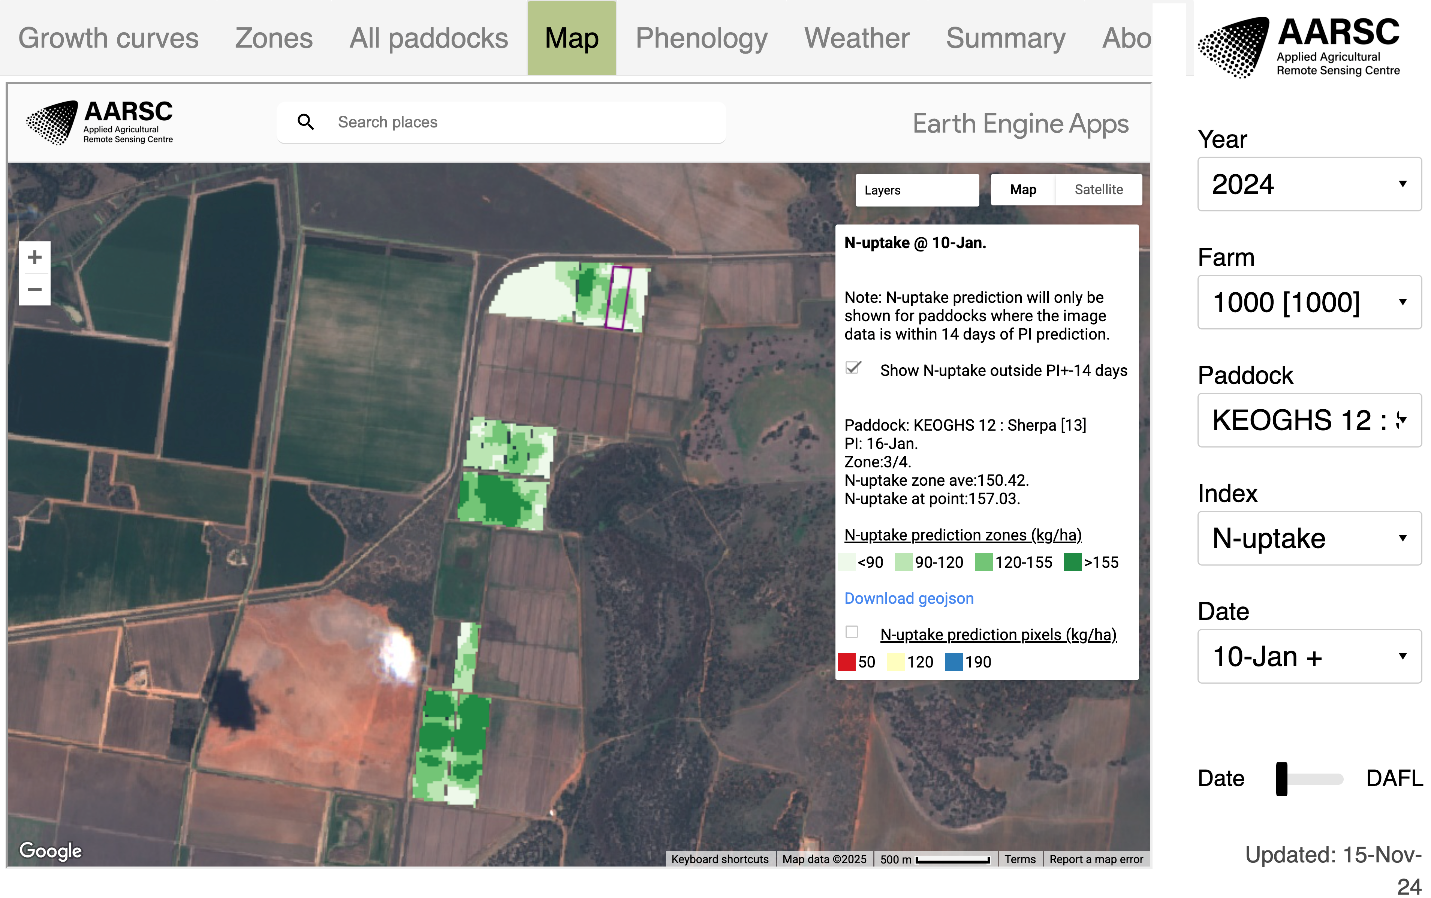
Figure 4. Predicted nitrogen uptake zonal map.
More information:
5. Grain moisture forecasts
As rice grains mature after flowering, growers are faced with the difficult decisions of the best time to drain fields, and then to harvest them. These decisions impact grain quality, as for example, fields that are harvested too late may be subject to excessive drying and rewetting during rain, which can cause grain cracking. Growers typically aim to have water drained at physiological maturity (28-26% grain moisture) and then harvest at 22% grain moisture.
The grain moisture forecast models use the most recent Sentinel-2 imagery to predict the grain moisture at the image date, and then weather forecasts beyond this to estimate dry-down. The models were trained using more than 1,600 grain moisture samples from commercial crops over 3 years, taken at approximately weekly intervals by NSW DPIRD. The grain moisture predictions are provided along with maps on a zonal basis, with 5 zones per paddock. An example is shown in Figure 5, where the predicted optimum harvest date for the paddock was 21 April. The models are validated against sample data collected each season. In the 2024 season, the predicted 22% moisture date had a mean absolute error of 5.1 days.
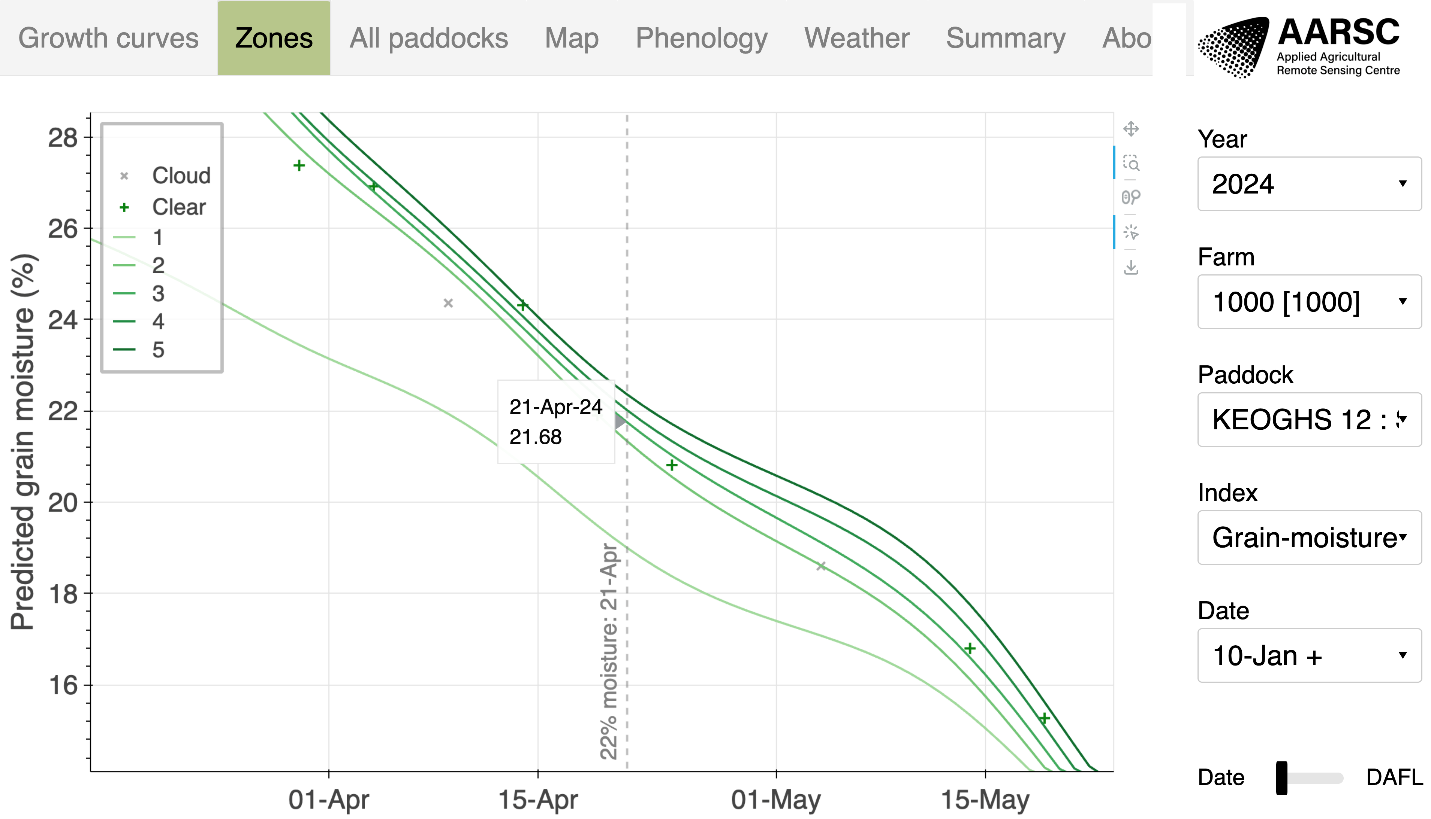
Figure 5. Grain moisture predictions for 5 zones within the paddock, indicating the optimum harvest date when the field median moisture is 22%.
More information:
6. Yield forecasts
Yield forecasts are important for industry, in order to manage grain handling and storage logistics and marketing. They also provide insight to growers into the drivers of high yielding crops, in order to optimise productivity. The yield forecast models were trained using per-crop yield data gathered from the majority of the irrigated NSW rice crops since 2018. They incorporate information from many of the models described above, including phenology and remotely sensed vegetation index data. Forecasts are updated as the season progresses, with accuracy improving as more data becomes available. Some of the most important predictors of yield were rice variety, red-edge related indices from remote sensing and temperature around flowering. In 2024, the yield forecast models were validated against 613 crops, with a mean absolute error of less than 10%. Currently, the models are designed to forecast per-paddock yield to enable industry-wide analysis.
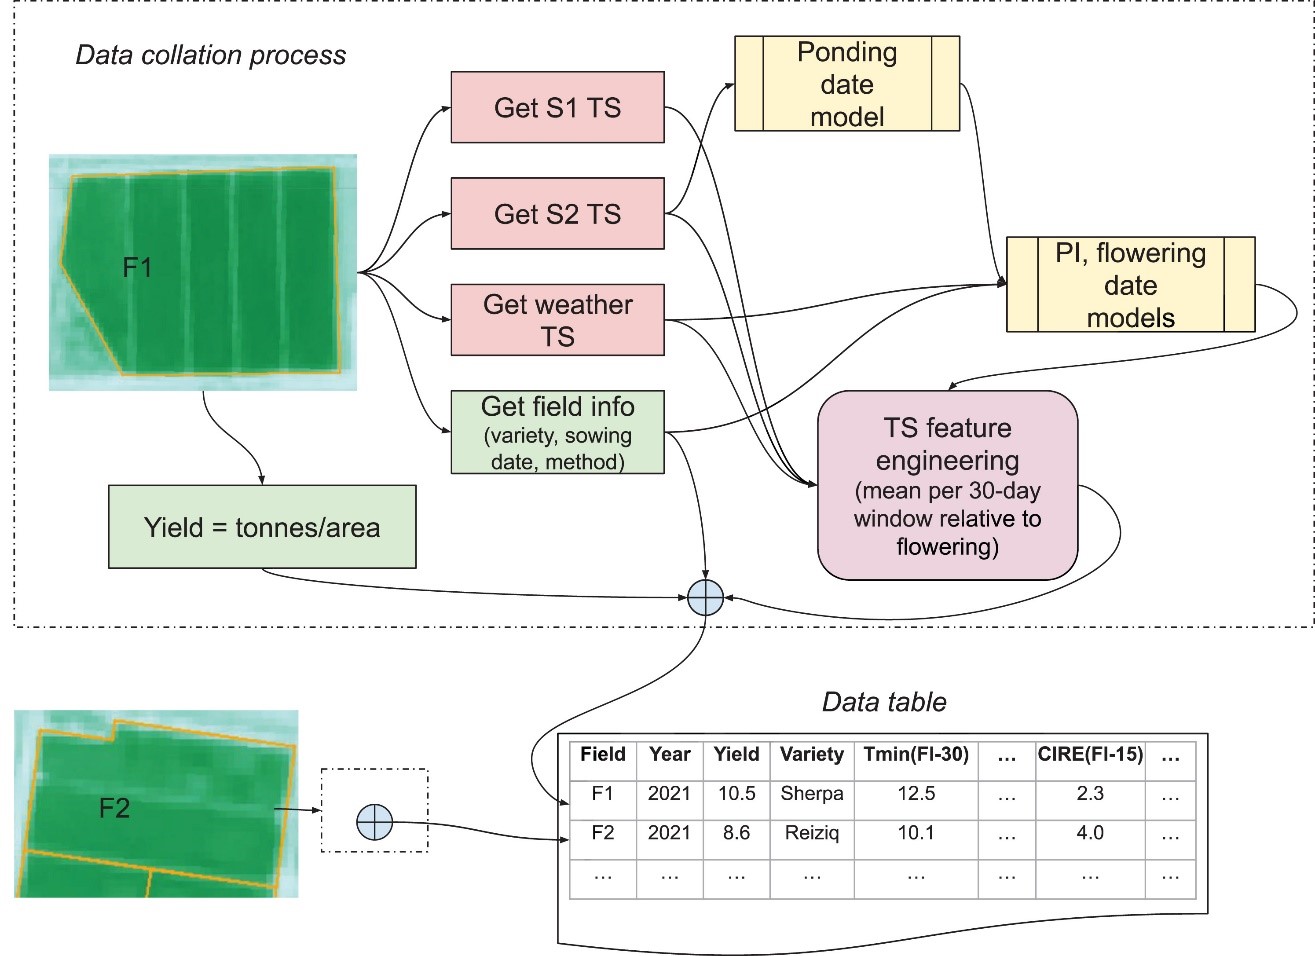
Figure 6. Illustration of the integration of many of the models in order to develop machine learning models to forecast rice yield.
More information:
7. Industry-wide benchmarking analysis
We work with Rice Extension to analyse nitrogen and water use, yield and productivity data each year. These analyses make use of many of the other models developed in this project, for example, to quantify the effect of early/late sowing, ponding and phenology on yield. Many of these analyses results and interpretations are included in Rice Extension’s 2024 annual summary.
Conclusion
The project outputs have been integrated into a cloud-based software system. This has successfully delivered the rice management dashboards for all Riverina rice crops over the past several seasons. Each dashboard is updated with the latest satellite and weather data, and model predictions, every day. The tools have widespread adoption by growers, agronomists, extension teams and processors. We continue to improve models every year as new data becomes available and to develop additional practical decision support tools for rice growers and the industry.


