Work on Australia’s first national map of “protected cropping” facilities is starting to wrap up, with some surprising findings.
An early outcome of the project lead by UNE’s Applied Agricultural Remote Sensing Centre (AARSC) was the discovery that Australia has about 30% more protected cropping systems than had been previously estimated.
Following the precedent of the pioneering Australian Tree Crop Map, also developed by AARSC, the National Protected Cropping Map is aiming to plot all the nation’s commercial glasshouses, polyhouses, polytunnels, shade houses, and permanent netting structures larger than 2000m², with the map to be made publicly available online.
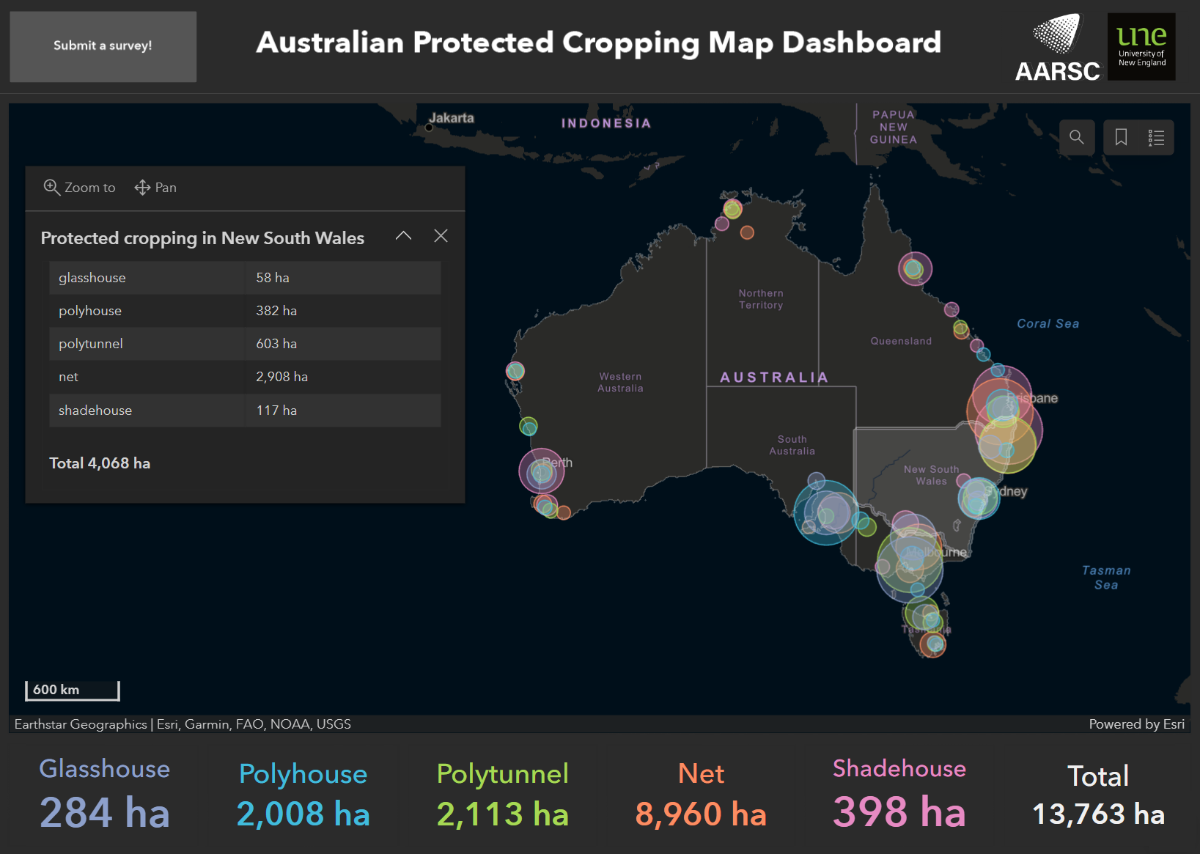
The Centre’s initial survey of the nation’s protected cropping systems has documented 13,763 ha of structures—4,405 ha of greenhouses (including glasshouses, polyhouses and polytunnels) and 9,358 ha of nets (shadehouses and permanent nets).
This first draft mapping of Protected Cropping Systems can be viewed through the Australian PCS Dashboard - https://arcg.is/1ebimm0.
When complete, the map will provide the protected cropping industries with a powerful tool for capitalising on opportunities and responding to biosecurity threats.
“Not having an accurate measure of production area can result in highly inaccurate pre-harvest yield forecasts, potentially causing poor forward selling estimates for both domestic and overseas markets," said Matthew Plunkett, who chairs the industry body Protected Cropping Australia.
"Identifying the location of specific farming systems also supports improved decision-making around extent (area) of production and annual changes, infrastructure planning, labour, transport and storage logistics, advocacy at all levels of government as well as serve as an essential tool for improved biosecurity preparedness and natural disaster response and recovery .”
Byron De Kock, Hort Innovation’s Head of Research and Development, says that understanding the distribution and area of specific crops is also invaluable in times of crisis.
"Knowing where crops are located supports improved response to biosecurity incursions, including the establishment of exclusion zones and the coordination of on-ground surveillance, and for quantifying the area of crops affected following a natural disaster,” Mr De Kock said.
AARSC is drawing on a range of techniques to create the protected cropping systems map.
“As with the Australian Tree Crop Map, the map is being built via the integration of industry data, image analytics, ground validation and citizen science,” said AARSC Director, Professor Andrew Robson.
“Like its predecessor, the outcomes of this project will meet Australian mapping standards, be freely available and will respect growers’ privacy by not including any personal grower or crop information.”
True to the Centre’s specialty, map-building starts with satellite imagery passed through machine learning (ML) using custom algorithms to provide an prediction of likely protected cropping structures.
Remote sensing data is then cross-referenced with information from government, Local Land Services (LLS) and industry – these entities also provide their own additional data – to compile initial draft regional maps.
To refine the ground-truthing process, the draft maps are published in an interactive web-based map where interested parties, including protected cropping producers, can review and comment on the map using the Industry Engagement Web Application (IEWA) and the PCS Survey App. The AARSC project team uses this feedback to further refine and improve the map.
“Engaging with stakeholders is essential in building an accurate map,” says AARSC lead commodity mapping researcher Craig Shephard. “Direct participation from industry also offers some ownership of the process, and therefore a greater likelihood the final mapping will be widely promoted and adopted post development.”
“Anyone can contribute and add to our database using the location-based tools in our industry applications gallery (www.une.edu.au/webapps). They can also provide feedback directly on the map as comments, including specifying the locations of new and future crops.”
AARSC is still seeking industry input via its Protected Cropping Systems survey – see breakout.
The interactive Australian PCS Dashboard offers a variety of perspectives of the nation’s protected cropping industry.
At national scale, clicking the map returns the total area of each structure type by state and territory, while zooming into the map shows Local Government Areas. Zooming in to local scale reveals the PCS polygons, which can also be clicked to show information in a pop-up window. Panning and zooming the map interactively summarises the total area of structures within the map view extent.
The project team aims to finalise the national baseline map in June, with further research and development of methods using machine learning for the automatic detection of PCS, as well as web-based applications to support industry in future maintenance of the map. Stakeholders and growers are encouraged to contribute by viewing the draft mapping and adding their feedback to the research team.
The project is funded through the Hort Frontiers Advanced Production Systems Fund, a part of the Hort Frontiers strategic partnership initiative developed by Hort Innovation, with co-investment by the industry body Protected Cropping Australia (PCA), UNE, Future Food Systems CRC and Greater Sydney and North Coast Local Land Services.
